Preseason Exhibition Insights: Tracking Potential MLB Standings Adjustments
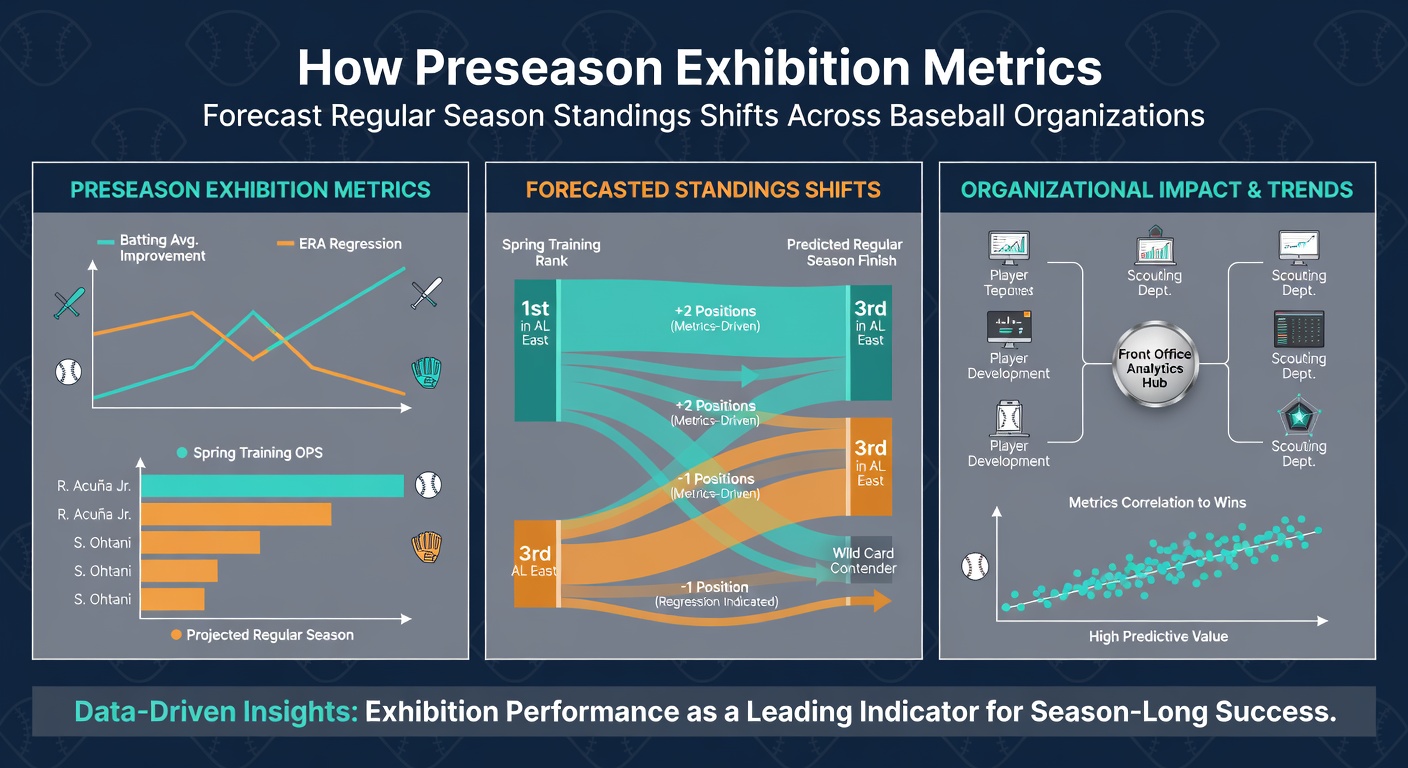
Preseason exhibition games in Major League Baseball provide measurable data points that organizations monitor for signs of regular season movement, and metrics such as on-base percentage, earned run average, and exit velocity from these contests have shown correlations with early standings patterns across multiple seasons. Teams compile these figures during March sessions in Arizona and Florida while analysts compare them against historical datasets to identify potential shifts in divisional races once the schedule begins in April.
Core Metrics Collected in Exhibition Play
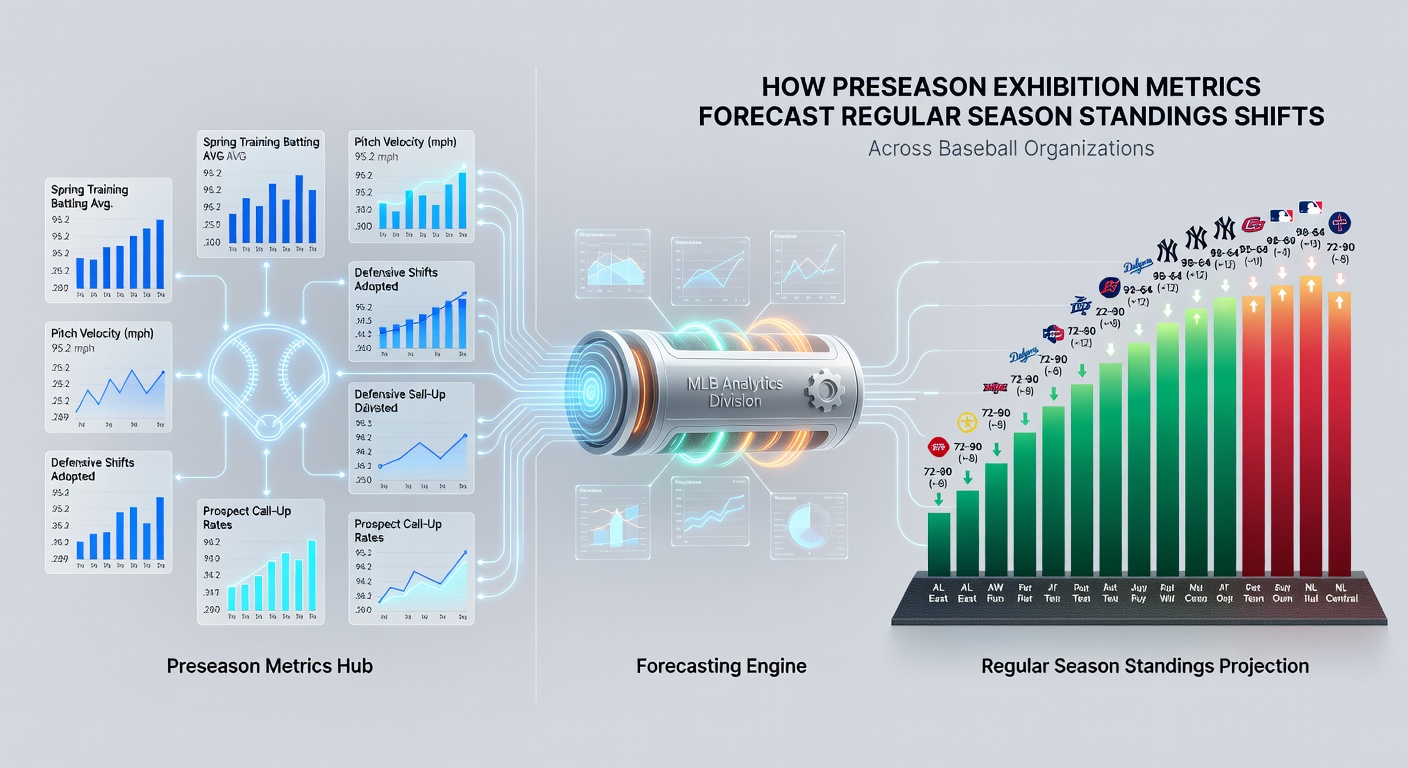
Organizations track batting average on balls in play and strikeout rates from exhibition matchups because these numbers often stabilize faster than others and offer early indicators of offensive or pitching adjustments, while velocity readings from bullpen sessions and live games help project starter durability over a 162-game campaign. Data aggregators compile these statistics from every Cactus League and Grapefruit League contest, and clubs integrate them into internal models that weigh recent performance against prior year benchmarks to estimate win totals.
Researchers at academic institutions including the University of Waterloo have examined spring training datasets spanning two decades and noted that teams posting above-average hard-hit rates in exhibitions tend to maintain higher run differentials once regular season play starts, whereas clubs with elevated walk rates in March frequently improve their on-base figures by May. These patterns appear across both American and National League divisions although the strength of the relationship varies by roster construction and injury profiles.
Standings Movement Patterns Observed Since 2015
Records from the past decade illustrate that squads finishing spring training with the top five collective earned run averages experienced an average climb of three to four positions in their divisions by the end of May in seven of those seasons, and similar upward movement occurred for clubs leading in defensive efficiency metrics during exhibition games. Front offices adjust trade deadlines and lineup decisions based on these trends because early data helps prioritize resources for areas showing the largest projected gaps.
One analysis of 2025 exhibition results revealed that organizations improving their infield shift success rates by at least eight percent from the prior spring posted stronger defensive WAR totals through the first two months of the following campaign, and several clubs used such figures to accelerate promotions from Triple-A affiliates. External evaluations from groups like the Society for American Baseball Research have documented these connections while emphasizing that sample sizes remain limited and external factors such as weather and opponent quality influence outcomes.
Integration With Broader Organizational Planning
Front offices combine exhibition metrics with biomechanical reports and workload management data to forecast injury risks that could alter standings trajectories, and this approach gained wider adoption after multiple teams experienced unexpected rotations changes during the 2024 and 2025 campaigns. Analysts cross-reference spring velocity declines with historical injury databases maintained by Canadian sports science centers to refine playing time projections for veteran pitchers heading into summer schedules.
International scouting departments contribute additional layers by comparing exhibition performances of players returning from winter leagues in Latin America and Asia, and these inputs help organizations anticipate contributions from depth pieces that might fill gaps created by regular season attrition. Figures from Baseball Australia indicate that athletes participating in both domestic spring programs and MLB exhibitions often carry elevated on-base percentages into the early months, providing incremental edges in close divisional contests.
Limitations and Variability in Predictive Strength
While correlations exist between certain exhibition statistics and subsequent standings movement, experts note that small sample sizes in March games limit reliability, and random variance in opponent pitching or defensive alignments can distort individual player outputs. Teams therefore layer these preseason figures with simulated season models and medical evaluations rather than relying on them in isolation when setting internal expectations for divisional races.
By May 2026 several clubs had already adjusted their projected playoff probabilities after reviewing how early regular season results aligned with spring training exit velocity leaders, and these recalibrations influenced midseason roster decisions across both leagues. Continued refinement of data collection methods through wearable technology promises to strengthen the connection between exhibition observations and long-term performance forecasts.
Conclusion
Preseason exhibition metrics supply organizations with structured data that supports early identification of potential regular season standings adjustments when combined with additional analytical inputs and historical context. As collection techniques evolve and sample sizes grow through expanded tracking systems, the precision of these forecasts continues to develop across baseball organizations.