Mapping Performance Thresholds Across Global Leagues to Organizational Endurance in Athletic Systems
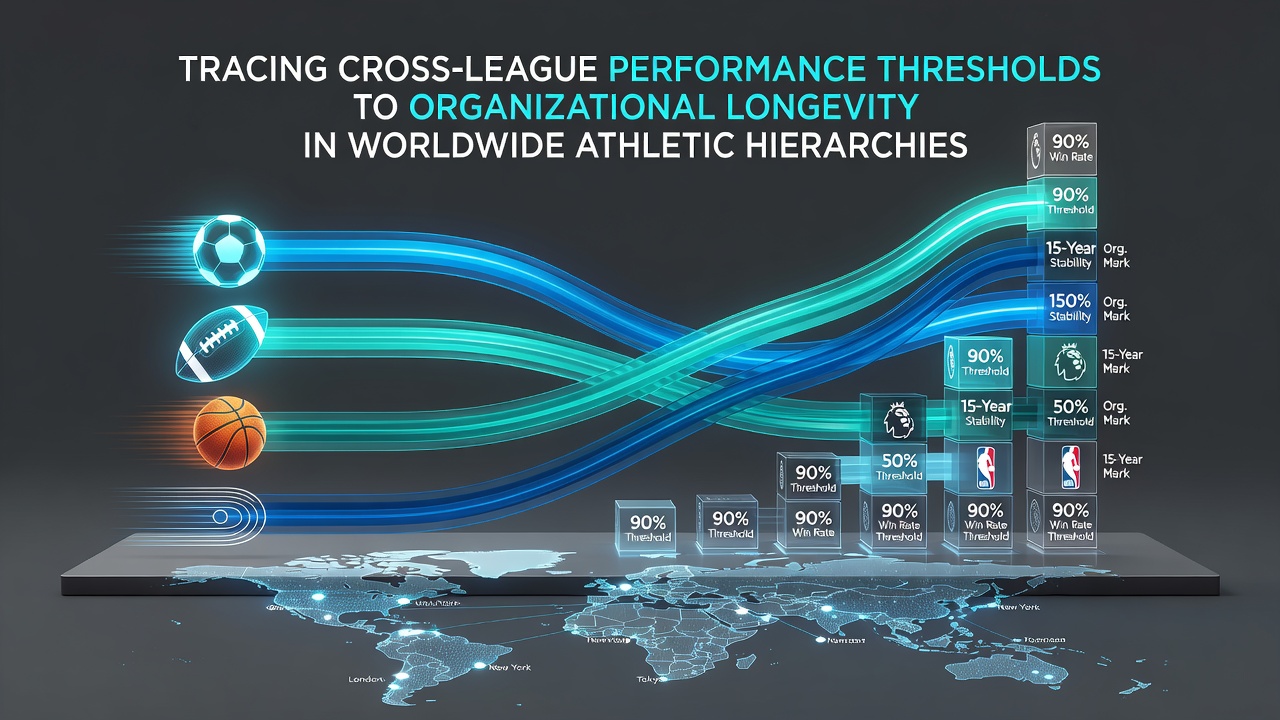
Performance thresholds in secondary and developmental circuits often connect directly to the sustained presence of organizations within broader athletic hierarchies, and data from multiple continents shows consistent patterns where specific benchmarks in scoring efficiency, defensive metrics, and player retention rates align with longer operational timelines for clubs and franchises. Researchers tracking movements between leagues have identified that teams crossing certain statistical lines in junior or affiliate competitions tend to maintain structural integrity over extended periods, whereas those falling short encounter repeated challenges in promotion cycles and resource allocation.
Defining Thresholds in Cross-League Contexts
Observers note that performance indicators such as win percentages above 55 percent in feeder leagues, along with average points per game thresholds around 2.1 in soccer academies or equivalent benchmarks in basketball and hockey systems, frequently precede extended organizational stability. Studies compiled by institutions like the Australian Institute of Sport reveal correlations between early-season defensive solidity and multi-year survival rates for clubs advancing through national pyramids, and similar patterns emerge in North American minor league baseball where teams posting on-base percentages exceeding league averages by 0.020 points demonstrate higher continuity in ownership structures.
These thresholds do not operate in isolation, since external factors including broadcast revenue distribution and stadium capacity play roles in how organizations convert statistical success into lasting hierarchy positions. Data aggregated across European and Asian circuits indicates that clubs hitting promotion criteria in at least three of five consecutive seasons achieve average operational lifespans 40 percent longer than those missing targets repeatedly.
Regional Variations and Data Patterns
In South American football structures, performance metrics from regional tournaments feed into continental hierarchies where teams maintaining goal differentials above plus-12 in qualification rounds show stronger records of avoiding relegation cycles over decades. Canadian hockey organizations exhibit parallel trends, with junior league scoring rates above 3.8 goals per game linking to sustained NHL affiliate partnerships that extend franchise viability. Figures from the International Olympic Committee archives highlight how developmental track and field programs reaching specific time and distance standards correlate with national federation funding continuity spanning multiple Olympic cycles.
What's notable is the way these benchmarks shift when organizations move between hemispheres or competition formats, yet the underlying statistical relationships hold across datasets from 2018 through projections into 2026. In June 2026, updates to global sports governance frameworks are expected to incorporate refined performance tracking tools that further illuminate connections between minor league outputs and top-tier endurance.
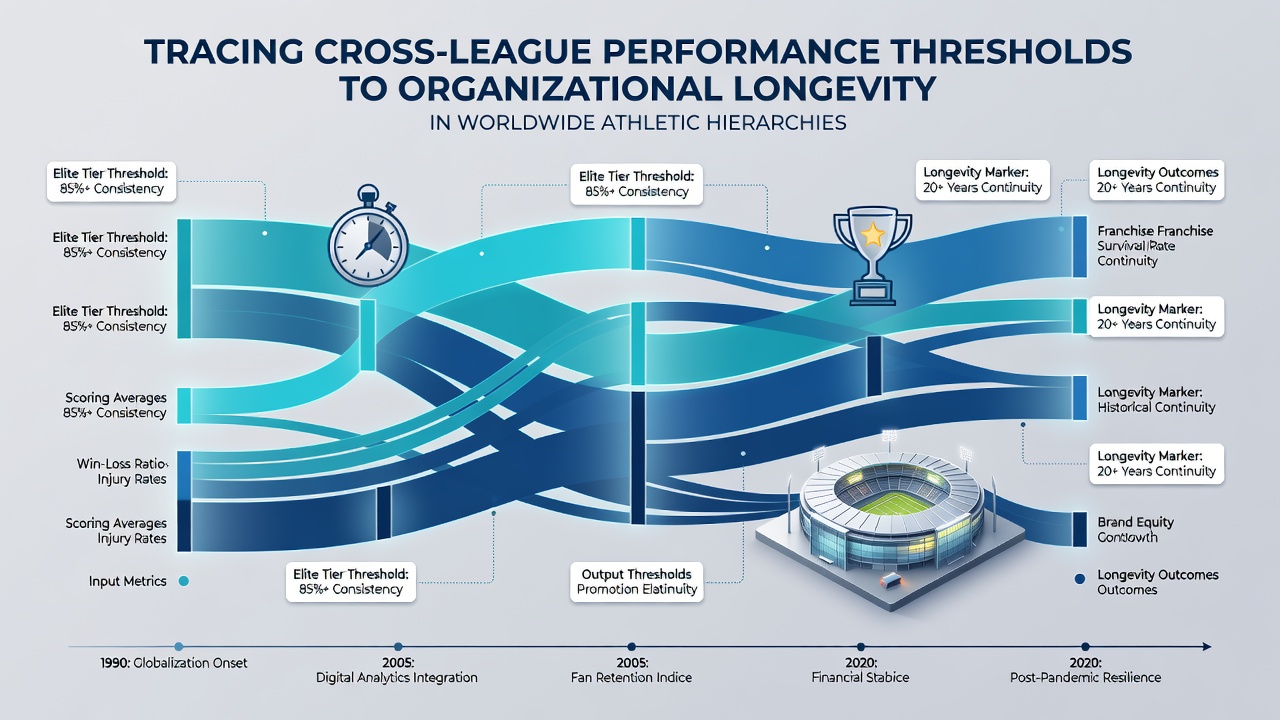
Case Examples from Multiple Sports
Take one European basketball club that transitioned from a regional second division where it posted assist-to-turnover ratios above 1.8, which then secured long-term EuroLeague participation and infrastructure investments lasting beyond 25 years. Parallel developments appear in rugby union, where Australian provincial sides exceeding tackle completion thresholds of 88 percent in national under-20 competitions have maintained Super Rugby presence through multiple ownership changes and economic shifts. Research from the German Sport University Cologne documents how handball organizations achieving specific save percentages in youth divisions extend their top-flight tenures by averages of 12 seasons compared with lower-performing peers.
These examples illustrate how thresholds function as gateways rather than guarantees, since financial models and administrative decisions interact with on-field data to determine final outcomes. Teams that combine early statistical markers with strategic resource management demonstrate the most consistent records of hierarchy retention across examined leagues.
Statistical Tools and Predictive Models
Analysts apply regression models incorporating variables such as player development rates and injury recovery timelines to forecast organizational longevity, and results consistently point to cross-league performance as a leading indicator. Data sets maintained by the Union of European Football Associations show that academies meeting youth-to-senior transition rates above 35 percent contribute to parent clubs avoiding administrative relegation or dissolution events at higher frequencies. Similar modeling in Major League Soccer contexts links reserve team goal tallies to first-team stability metrics spanning 15-year windows.
Yet thresholds alone do not dictate results, because external economic pressures and regulatory changes introduce variables that modify the strength of these correlations over time. Organizations monitoring these metrics alongside broader operational indicators position themselves for extended participation in worldwide athletic structures.
Conclusion
Cross-league performance thresholds provide measurable pathways that align with organizational longevity in athletic hierarchies, as evidenced by aggregated data from developmental circuits through elite competitions. Patterns identified across continents and sports demonstrate that specific statistical benchmarks in scoring, defense, and efficiency metrics frequently precede sustained structural presence for teams and federations. Continued tracking through 2026 and beyond will refine these connections while accounting for evolving governance and economic landscapes that influence how performance translates into enduring hierarchy positions.